Communicating the Cost of County Government
Unfunded Mandates Survey
Editor’s Note:
This survey report was released last year as a communication tool to help explain the cost of unfunded and underfunded mandates on property taxpayers. In the coming months, counties will be contacted and survey data will be updated in preparation for the 86th Session of the Texas Legislature, said Tim Brown, senior analyst with the Texas Association of Counties County Information Program, which helped prepare the survey report.
The full report includes additional charts, which can be viewed at http://bit.ly/unfunman2EvqW3v.
Introduction
In the current political and legislative environment, there is much talk about further restricting the ability of counties to generate revenue to carry out their responsibilities. These responsibilities include duties mandated by state and federal law, as well as other services county residents expect but are discretionary. These elements represent the basic cost of the basic government that counties have provided since the days of the Republic.
In order to assist county officials to explain the cost of unfunded and underfunded mandates on property taxpayers, several county associations joined together to conduct a survey of counties. These associations are the Texas Association of Counties, the County Judges and Commissioners Association of Texas, The Texas Conference of Urban Counties, and the Texas Association of County Auditors.
The mandates included in the survey do not represent all mandates placed on counties, but they do represent many of the more significant ones and those that support the most basic services counties provide. We thank all the counties that participated and we anticipate conducting this survey on a regular basis into the foreseeable future. It is critically important for county officials to communicate to constituents, taxpayers, and legislators what it is counties do, how they do it, and how it is funded. We trust this survey will prove useful to these efforts.
Methodology
The 2016 Unfunded Mandates Survey was conducted online by the Texas Association of Counties in cooperation with the Texas Association of County Auditors, the Conference of Urban Counties and the County Judges & Commissioners Association of Texas during the summer and fall of 2016. After several extensions to allow more counties to complete the survey, data from 98 counties made it into this report.
The data was used to calculate percentage increases as well as statewide extrapolations for each survey question (FY 2011, FY 2012, etc.). If a county provided data for five or fewer of those years, then that data was not used in determining percentage increases over the prior year and any extrapolations.
Statewide extrapolations were based on Census Bureau population estimates for each year. Since the estimates for 2016 were not available at the time of writing this report, each county’s 2015 population estimate was used instead as a proxy for the 2016 extrapolations. Additionally, while the survey asked for expenditures for fiscal years 2011 – 2015, it asked for budgets for FY 2016 as many counties had not completed their fiscal years at the time the survey commenced. As the survey progressed, some counties completed their fiscal years and a number of them noted on the survey form that they were providing expenditures on certain questions. As result, both the reported expenditures and the statewide extrapolations for FY 2016 are based on a combination of both budgeted amounts and expenditures.
However, statewide extrapolations do not make sense for every question on the survey. Therefore, where appropriate, the extrapolations were modified to cover only the counties covered by the identified mandates bracketed to counties over certain population thresholds or were left off entirely.
In addition to the survey data provided by county sources, complementary data was collected from other sources. For example, indigent defense data was obtained from the Texas Indigent Defense Commission. And, occasionally expenditure data from other sources was used in the report instead of asking counties to provide information already available from public sources.
Results
Although there was significant variation between mandates, most showed a significant tendency to increase in cost over time. While this was not always apparent from year to year as costs increased in some years and decreased in others, it became clear over the full six year period of the survey.
Elections
Counties are required to hold and pay for special elections, which may be called to fill vacancies in public office or for other matters. For instance, in 2007, the governor called a May constitutional amendment election. These elections are typically unforeseen and are often expedited and held on non-uniform election dates. Significant variation was perhaps most notable in the expenditures for special elections. One would expect normal election expenditures to cycle up and down over a four year cycle; a graph would be expected to show troughs in odd-numbered years and peaks in even-numbered years – with the presidential election years having the highest peaks. However, special elections are slightly different since they can come in bunches or not at all nor do statewide projections make any sense since the majority of special elections are not statewide.
Yet, special elections can be very costly to counties. As shown in the first chart, 50 counties noted expenditures reaching $1.7 million in FY 2014 – an increase of 201.0 percent over the prior year! Total expenditures increased by 229.1 percent from FY 2011 to FY 2016.
Chart 1
While not all counties have special elections, federal law requires all counties to use electronic voting machines for their elections. While the federal government provided initial funding through the Help America Vote Act (HAVA) of 2002, counties pay the ongoing costs (programming, maintenance, storage, replacement, etc.). Based on responses from 72 counties, expenditures increased 29.4 percent from FY 2011 to FY 2016. Extrapolating to all 254 counties, estimated expenditures exceeded $8.8 million for FY 2016. Total estimated expenditures for all 254 counties increased by 29.6 percent from FY 2011 to FY 2016.
Chart 2
Justice System
Overall Justice System Expenditures
In Texas, counties provide a large portion of the financial support for courts and other elements of the justice system. Counties fund much of the district court operations (the state pays the base salaries of district court judges), county level courts (constitutional county court and county courts-at-law), and justice courts. While the state pays the salaries and benefits for district judges, counties pay all personnel and other operating costs plus provide the actual courtrooms/courthouses. Counties also fund county clerk offices, district clerk offices, and, in smaller counties, the office of the county and district clerk.
Prosecutorial offices, those of county attorneys, district attorneys, and criminal district attorneys, receive a large part of their funding from counties, as do lawyers appointed to indigent defendants in criminal cases and those appointed to represent children and indigent parents in certain Child Protective Services cases.
All of those expenses add up, extrapolating from the expenditures reported by 84 counties shows that statewide expenditures started out at over $1.2 billion dollars, reaching almost $1.6 billion for FY 2016. Total estimated expenditures for all 254 counties increased by 20.9 percent from FY 2011 to FY 2016.
Chart 3
It should be noted that not all counties necessarily included the same types of expenditures to determine their costs for supporting the judicial system, as not every county tracks these expenses in a similar manner. Generally, however, the estimated expenditures provide a helpful assessment of the total county costs for supporting the state’s court system.
Court-Appointed Attorneys in Child Protective Services Cases
Counties pay for the costs of court-appointed counsel in many cases. For example, in criminal cases, counties are responsible for the costs of court-appointed attorneys for indigent defendants. Counties pay for the attorneys and are reimbursed for only about 12 percent of those costs by the state. Additionally, counties must pay for all the costs of attorneys appointed to represent children and indigent parents in certain Child Protective Services cases. Sixty-seven counties provided their expenditures for court-appointed attorneys (ad litem) in Child Protective Services (CPS) cases; we asked that they exclude expenditures in criminal cases. Expenditures spiked somewhat in FY 2014 with an 8.8 percent increase before slowing to less than 3 percent increases in both FY 2015 and FY 2016. Hopefully, this recent tendency towards moderation will become a trend.
However, even with the recent moderation, when extrapolated to the entire state, estimated costs for court-appointed attorneys (ad litem) in CPS cases grew 28.1 percent from $35.6 million in FY 2011 to $45.6 million in FY 2016.
Collection Improvement Programs
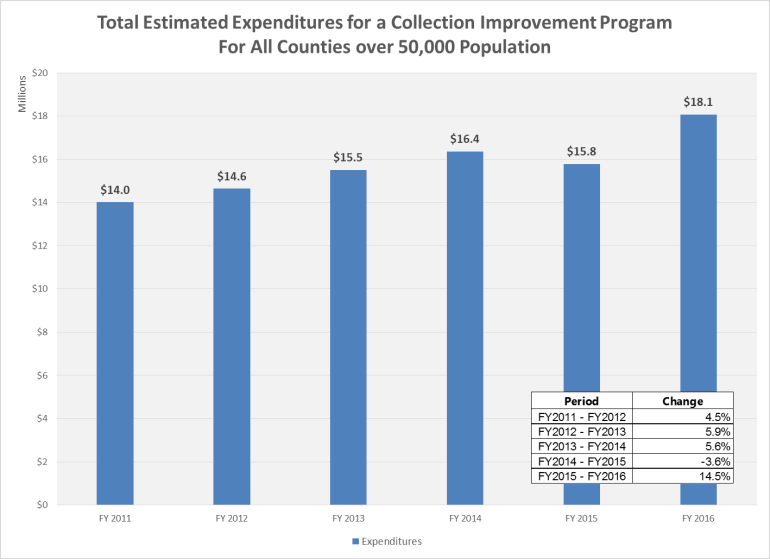
Costs for a mandated collection improvement program[1] grew almost as fast, increasing 28.9 percent between FY 2011 and FY 2016. The mandate was instituted to improve the collection of court costs, fees, and fines imposed in criminal cases. The program must conform to a model developed by the Office of Court Administration (OCA).
Although a number of additional counties with voluntary collection improvement programs provided their costs, the analysis presented here is limited to those counties mandated to have such a program (currently those with a population over 50,000).
Chart 4
Victim Assistance Coordinators
Since 1989, all district attorneys, criminal district attorneys and certain county attorneys have been required to designate a victim assistance coordinator to ensure a victim, guardian of a victim, or close relative of a deceased victim is afforded certain crime victims’ rights granted by statute.[2] When asked, 63 counties provided their expenditures for each fiscal year from 2011 to 2016. After extrapolating to all 254 counties, it was determined that statewide costs had increased 28.4 percent over this period from $7.7 million to $9.9 million. Annual increases remained fairly constant at around 4.5 – 5.0 percent per year except for a 7.4 percent increase in FY 2014. Total estimated expenditures for all 254 counties increased by 28.4 percent from FY 2011 to FY 2016.
Chart 5
Jury Pay
In addition to expenditures for various items related to the justice system, we also asked counties about their total (net of reimbursement) expenditures for jury pay.
Jurors and prospective jurors are entitled to reimbursement of expenses of not less than $6 for the first day of service and not less than $40 for each following day of service, which is paid by the county. The state is required to reimburse a county $34 a day for each juror for each day of service after the first day.[3] The county has the option of paying more per day if they choose, but the additional amount is not reimbursed by the state.
Net expenditures rose in most years although it decreased in two of the survey years. As a result, statewide extrapolations for overall net expenditures for jury pay, as shown in Chart 6, increased 19.2 percent over the survey period from $17.6 million in FY 2011 to $21.0 million in FY 2016.
Chart 6
Bail Bond Boards
Except in certain limited circumstances, a defendant held in jail retains the right to post bail. If bail is posted, the defendant is released from custody pending trial. While any county can create a bail bond board, counties with populations of 110,000 or greater are required to do so in order to regulate the bail bond practice, including the licensing of bondsmen.[4]
Among the counties required to have such a board, estimated expenditures increased 37.3 percent from FY 2011 to FY 2016 based on extrapolations from the 21 responding counties in the population bracket. While these expenditures occasionally decreased, they rose by more than 10 percent in three out of five years.
Chart 7
As an additional note, the data does not take into account the $500 filing fee that a bail bond surety must pay when applying for a license. The fee is collected by the county and can be used by the bail bond board for certain expenses.
E-Filing
Many people misunderstand what is meant by e-filing. It is simply an electronic delivery system. Once delivered, the court clerk must either print the document in order to add it to the official record or have a case management system that allows the clerk to access, maintain and deliver the record electronically. In a county that has not moved to such a paperless environment, the additional time and resources needed to produce paper copies of documents filed electronically can more than offset any cost savings from e-filing. However, the following discussion of expenditures covers only e-filing and not costs associated with either printing records or purchasing and maintaining a case management system.
Chart 8
Counties experienced a dramatic increase in expenditures for e-filing over the survey period. Based on statewide extrapolations from expenditures reported by 48 counties, costs rose from less than a quarter million dollars in FY 2011 to more than $5.2 million in FY 2016. This 2,139.3 percent increase would have been even higher had the survey period ended in FY 2015 when statewide expenditures are estimated to have reached more than $7.5 million; this large spike in expenditures resulted directly from the mandate to provide e-filing beginning at different dates, depending on population size, starting in January 2014.
Indigent Health Care
The financial responsibility of providing health care for indigent individuals has traditionally rested on counties.[5] In effect, counties in Texas provide for preventative and emergency care to county residents who are indigent and not otherwise covered by another source. In practice, these costs often fall to a hospital district or public hospital where they exist. Due to the existence of these other indigent care entities, some counties reported $0 for their expenditures on the survey and expenditures were not extrapolated to all 254 counties.
While gross expenditures were fairly consistent from year to year among the 79 counties providing data for all six survey years, a significant rise in expenditures, actual and budgeted, in FY 2016 resulted in an overall increase of 25.6 percent over the survey period.
Chart 9
Indigent Health Care of County Jail Inmates
In addition to the general mandate to provide indigent health care, counties operate under a mandate to provide certain constitutional minimum levels of care, including mental health care, while a person is incarcerated in the county jail.[6] As with indigent health care above, the survey results for this question were not extrapolated to all 254 counties.
Chart 10
Expenditures for the 80 counties that provided data for all six years varied from virtually no change from FY 2011 to FY 2012 to an 8.8 percent increase in FY 2014. Overall, these expenditures rose 22.1 percent over the survey period as seen in Chart 10.
Training
County officials, both elected and appointed, as well as county staff have numerous training requirements.[7] While counties can obtain some funding from state and federal sources, the majority of the funding comes from local sources. For both survey questions on training expenditures, we asked counties to provide their net costs (total costs less state and federal funding).
Mandated Training for Officials and Staff
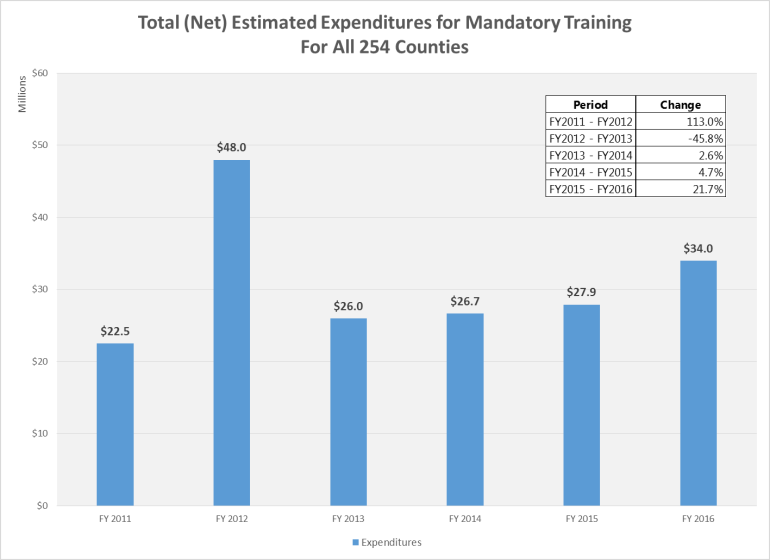
We asked counties how much mandatory training cost them, but did not ask them to include the salary costs of those attending training nor the costs of replacing missing personnel while they were being trained. Reported expenditures from 72 counties were used to create a statewide extrapolation of expenditures for mandatory training as seen in Chart 11.
Chart 11
Statewide mandatory training expenditures increased 50.9 percent from FY 2011 to FY 2016. Net costs varied significantly at times as expenditures rose 113.0 percent in FY 2012 only to fall 45.8 percent the following year.
Mandated Training for Jail Staff
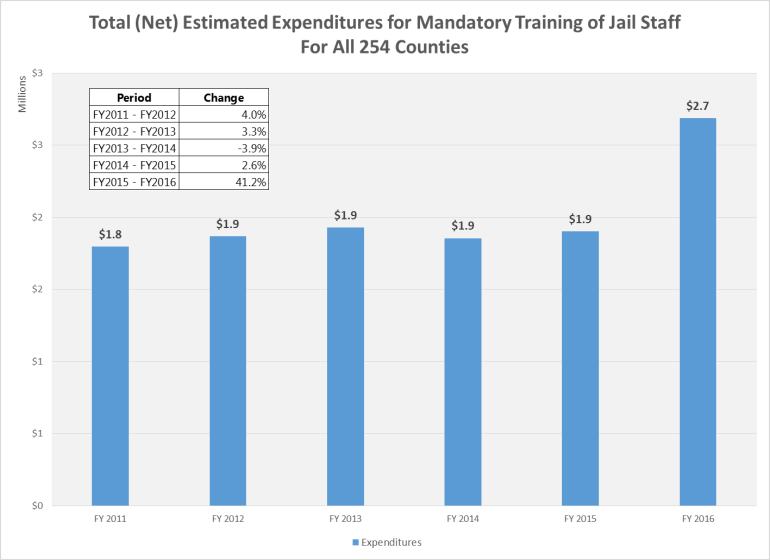
We also asked counties to break out their expenditures for training jail staff from the overall training costs provided in the previous survey question. Seventy-six counties provided their expenditures from which the statewide extrapolations shown in Chart 12 were created.
Chart 12
While these costs remained fairly steady over most of the survey period, they rose dramatically in the most recent survey year, with an overall gain of 49.5 percent from FY 2011 to FY 2016.
County Jail
Total Operating Costs
Counties typically allocate a significant portion of their budgets towards operating the county jail. These costs arise because of numerous contributing factors such as physical plant maintenance and logistics, staffing ratios, mandatory training, meal pricing, utility services, life safety standards (i.e., smoke evacuation system, generators, etc.), extraordinary medical, dental and mental health care, and the number and type of inmates confined.
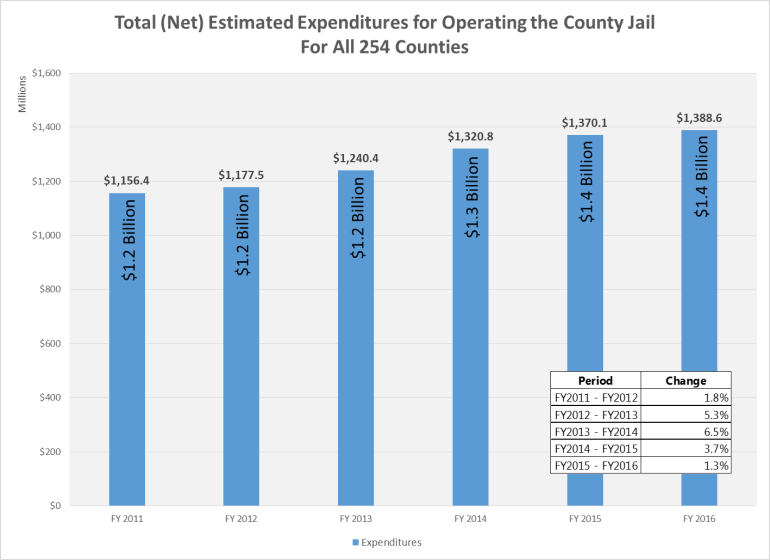
Data from 83 counties[8] was utilized to extrapolate statewide expenditures for operating county jails as seen in Chart 13. Extrapolated expenditures rose 20.1 percent over the survey period reaching almost $1.4 billion in FY 2016. It is estimated that statewide, counties spent more than $7.6 billion from FY 2011 – FY 2016 to operate their jails.
Chart 13
Emergency Room Visits
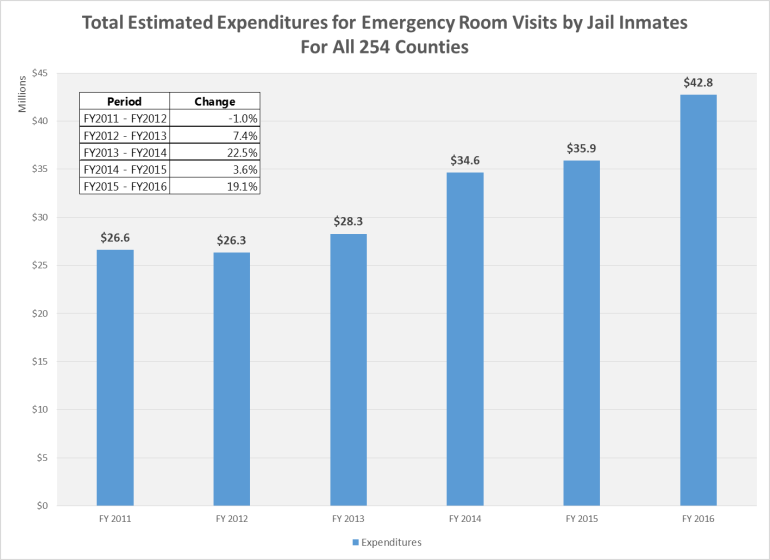
County jails must provide medical care to all inmates and sometimes must seek assistance in hospital emergency rooms. Unfortunately, many counties do not track these costs separately from other jail or medical costs. Consequently, only 41 counties were able to provide their expenditures for jail inmates’ trips to hospital emergency rooms.
Extrapolating to all 254 counties shows emergency room expenditures of $42.8 million by FY 2016, up 60.7 percent from FY 2011. On a percentage basis, most of that increase came in FY 2014 when expenditures rose 22.5 percent as seen in Chart 14.
Chart 14
Prescription Drugs
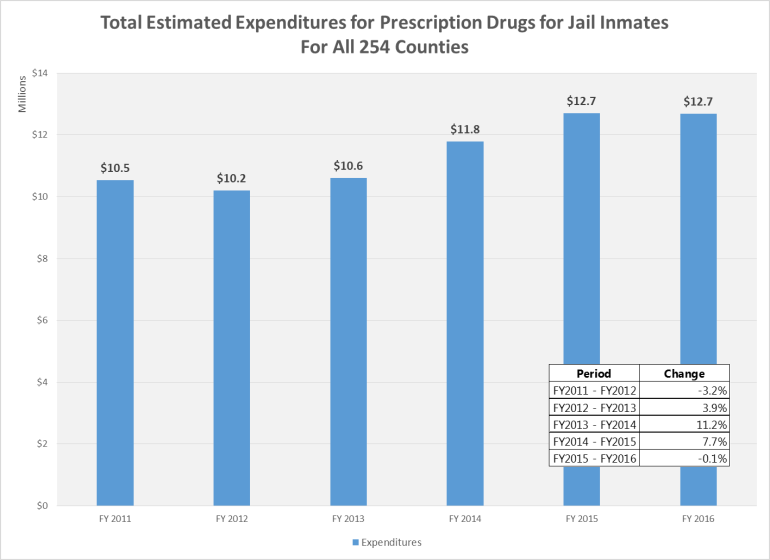
In addition to emergency room expenditures, we also asked counties about their expenditures on prescription drugs for jail inmates. Fifty-five counties responded with data for all six years of the survey period; Chart 15 shows the statewide expenditures extrapolated from their data.
Chart 15
The extrapolated statewide expenditures grew the most in FY 2014 with an 11.2 percent gain. This was followed immediately by a 7.7 percent increase in FY 2015. It is too soon to tell if the decrease in FY 2016 is the beginning of a trend or merely a short term aberration; however, historically medical costs have proven far more likely to grow than to shrink. Total estimated expenditures for all 254 counties increased by 20.4 percent from FY 2011 to FY 2016.
Mental Health Evaluations
In Texas, many of those needing psychiatric care repeatedly cycle through the criminal justice system instead of receiving treatment. While the state of Texas has taken great strides toward increasing crisis services and community mental health diversion programs, local mental health authorities (LMHA) remain woefully underfunded and struggle to keep pace with community needs. The problem is felt most acutely by individuals who need services but are not in immediate crisis, including those in county jails; due to limited financial and manpower resources, LMHAs attend to individuals in the most danger ahead of those who are being actively monitored, turning county jails into waiting rooms.
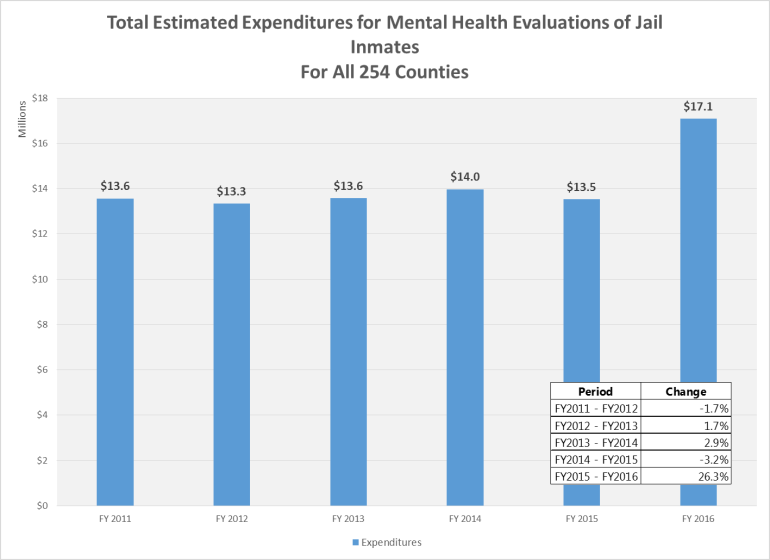
Using data from 43 counties, we extrapolated statewide expenditures for mental health evaluations of jail inmates. The results showed fairly consistent costs of just under $14 million per year for FY 2011 through FY 2015. However, expenditures increased 26.3 percent in FY 2016 as seen in Chart 16. Total estimated expenditures for all 254 counties increased by 25.9 percent from FY 2011 to FY 2016.
It should be noted that expenditures for mental health evaluations are only one small part of the total costs to counties from using jails to hold individuals who need and wait for mental health care.
Chart 16
Probation
Adult Probation
Community Supervision and Corrections Departments (CSCDs) supervise and monitor court orders for defendants whose criminal sentences have been suspended and probated with conditions to be met in lieu of going to jail or state prison. CSCD funding comes from a mixture of state and local dollars, grants and court-ordered supervision fees paid by defendants.
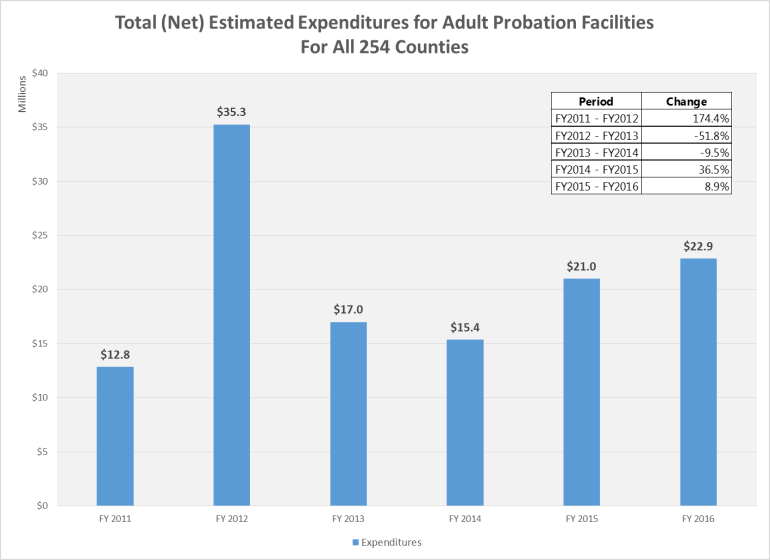
Rather than ask for total adult probation costs, we asked counties about their net expenditures for adult probation facilities. We received useful data from 75 counties from which we calculated the statewide extrapolations seen in Chart 17. The large spike in FY 2012 comes from the construction of new adult probation facilities in Denton County which, when extrapolated with the data from the other 74 counties, resulted in estimated statewide expenditures of $35.3 million for the year. The 77.9 percent increase from FY 2011 to FY 2016 would have been even higher if Denton County had allocated the costs to multiple years (FY 2012 and following) rather than reporting the total amount in a single year.
Chart 17
Juvenile Probation
Juvenile probation is administered locally, with state oversight, and funded by a combination of both state appropriations and local funds. However, county funding accounts for 70 percent of the total.
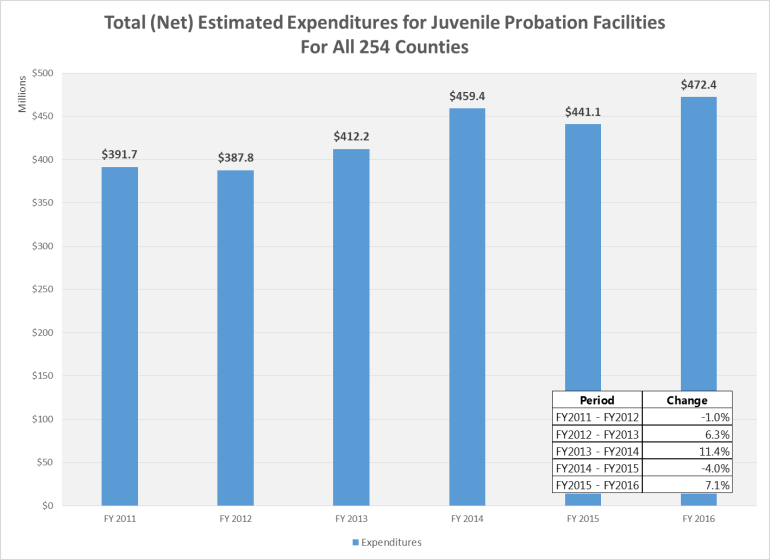
We asked counties for their net expenditures on juvenile probation. The statewide extrapolations in Chart 18 come from data supplied by 80 counties. Even though expenditures fell in two of the survey years, overall net statewide expenditures increased 20.6 percent over the survey period to $472.4 million.
Chart 18
The Deceased
Indigent Burials
It often falls to counties to deal with the remains of individuals who are indigent at their time of death.[9] Most often this means the county pays for each of these individual’s burials. However, some counties have adopted a policy of cremation where circumstances allow.
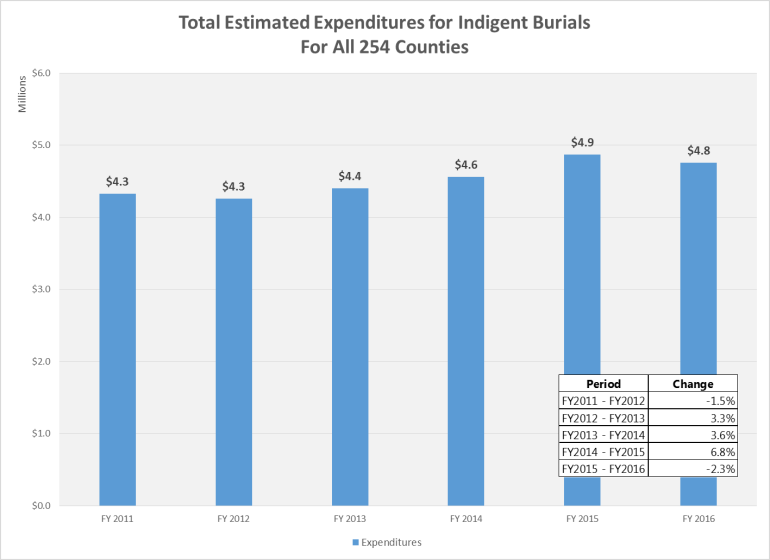
While we did not ask counties to specify their policies on indigent burials, we did ask for information on their expenditures. Chart 19 shows the statewide estimates of county expenditures for indigent burials from data provided by 78 counties. Expenditures peaked in FY 2015 at $2.3 million before falling slightly in FY 2016 for an overall increase of 10.5 percent over the survey period.
Chart 19
Medical Examiner’s Office
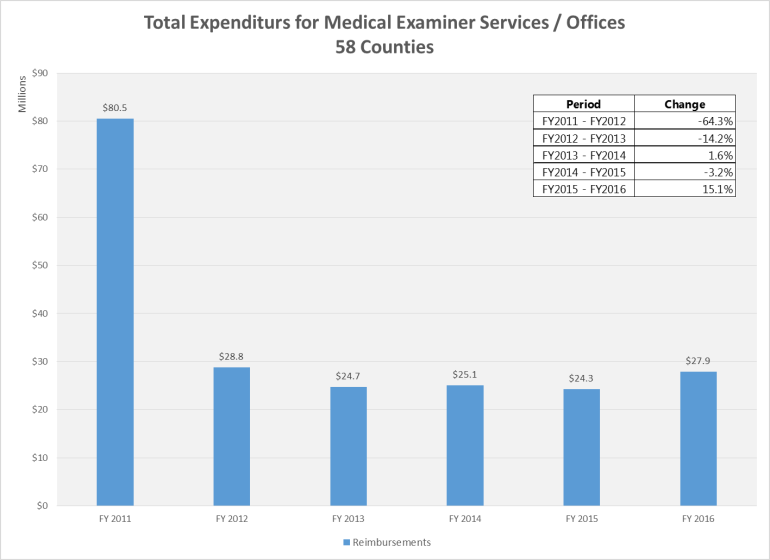
Although only five counties are mandated to maintain a medical examiner’s office, 58 counties told us they had expenditures for either a medical examiner’s office or for a medical examiner’s services.[10] Those expenditures peaked in FY 2011 at the beginning of the survey period due to Tarrant County’s new $60 million building to accommodate its criminalistics (i.e., forensic sciences), toxicology and chemistry laboratories. Eventually expenditures leveled out around the $25 million mark during FY 2013 – FY 2015 before ending at $27.9 million in FY 2016. Total estimated expenditures for all 254 counties decreased by 65.3 percent from FY 2011 to FY 2016.
Chart 20
Autopsies
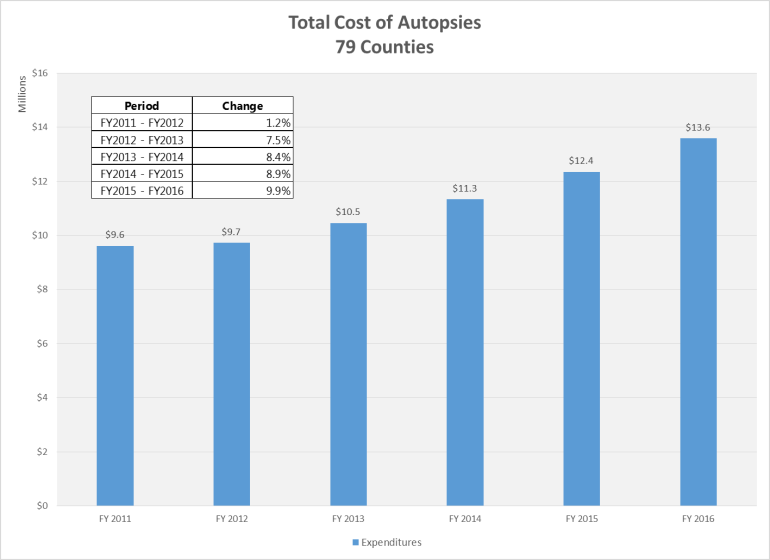
According to 79 counties, expenditures for autopsies increased 41.3 percent from FY 2011 to FY 2016 as seen in Chart 21. The chart shows net expenditures as we asked counties to adjust their data for payments received for providing autopsies to other counties. Note that no statewide extrapolation is provided. Total estimated expenditures for all 254 counties increased by 41.3 percent from FY 2011 to FY 2016.
Chart 21
Motor Vehicles
Costs for Collecting Motor Vehicle Fees and Taxes
County tax assessor-collector offices provide most vehicle title and registration services. In recent years, these offices have had to endure several modifications to the motor vehicle registration and titling system initiated by the Texas Department of Motor Vehicles (TxDMV). In addition, counties have dealt with a number of rule changes from TxDMV. For example, rules were adopted in 2016 which effectively decreased the funding that counties receive for performing registration services while not substantially decreasing the amount of work that counties must perform in order to complete registration services.
The 2016 rule changes occurred too recently to show up in the survey data since we requested FY 2016 budgets. Meanwhile, total estimated costs for collecting motor vehicle fees and taxes increased over the survey period. Extrapolations from data received from 71 counties show total statewide costs increased 20.1 percent as seen in Chart 22 – most of the increase occurring in the last two years.
Chart 22
Revenue from Collecting Motor Vehicle Fees and Taxes
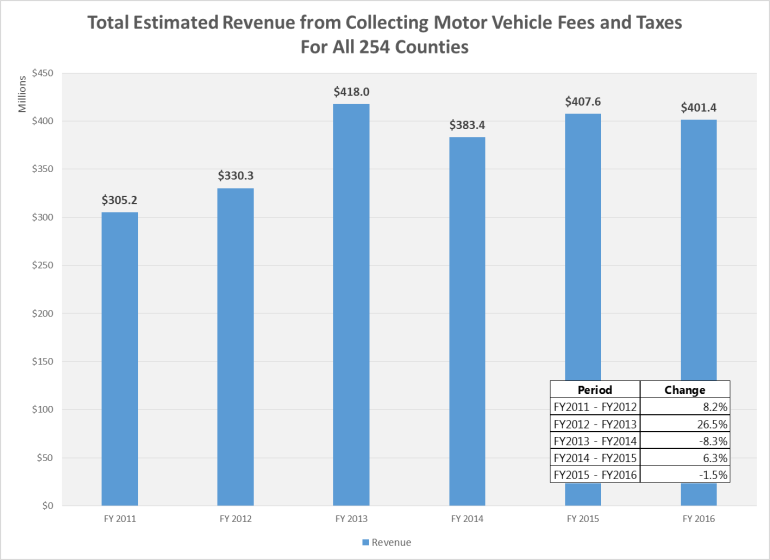
We also asked counties about their revenue from motor vehicle fees and taxes. Unlike costs, revenue extrapolations were somewhat variable and actually fell for FY 2016. Still, total revenue increased 31.5 percent from FY 2011 to FY 2016.
Chart 23
Other
Support for the Department of Public Safety
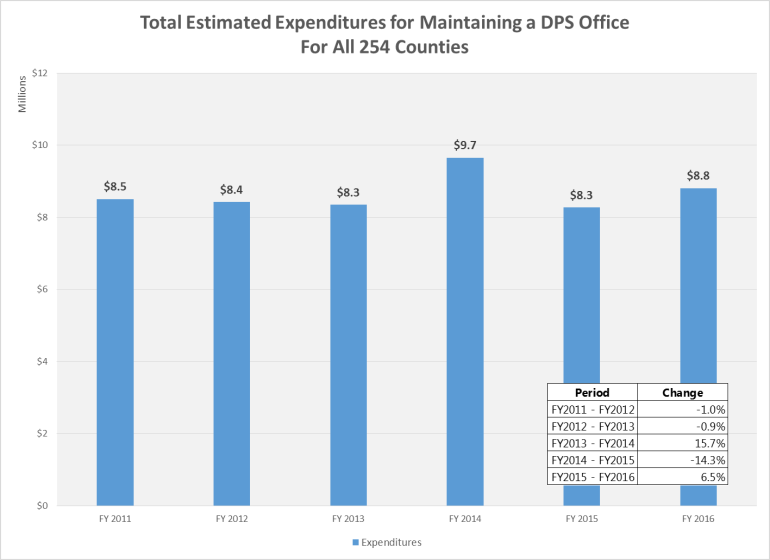
While no statutory mandate requires counties to maintain an office for the Department of Public Safety (DPS), they must do so if they want a DPS agent stationed locally. Even some large, urban counties end up with expenditures for DPS. In all, 76 counties provided expenditure data for maintaining a DPS office. Those expenditures peaked in FY 2014, however, the increase was the result of increased spending in multiple counties, not just one as was seen in adult probation.
Extrapolating to all 254 counties results in estimated costs of $8.8 million as of FY 2016, up 3.5 percent from $8.5 million in FY 2011.
Chart 24
Veterans
Counties are increasingly called upon to identify veteran needs and available services based on recent legislative mandates.[11] Currently, 23 counties are mandated to have a veterans’ service officer (VSO) but more than 230 smaller counties have at least a part-time officer and some counties have a staff in addition to their VSO.
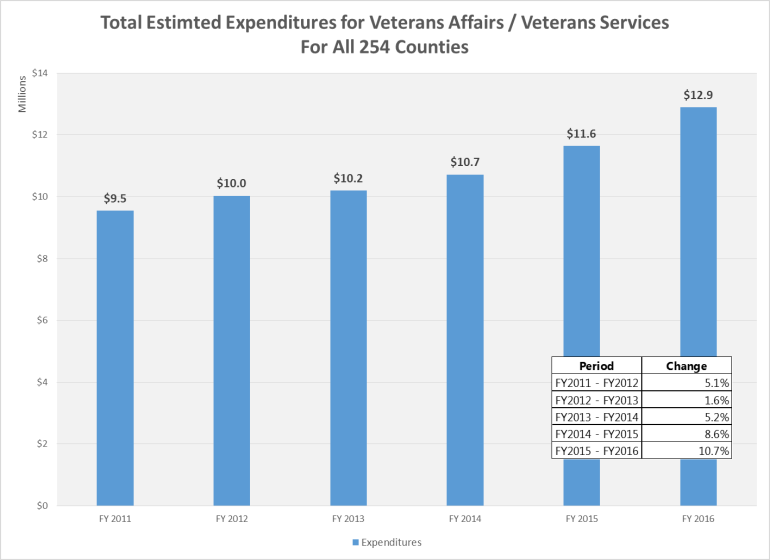
In regards to veterans, counties were asked to provide their expenditures for both veteran affairs and/or veteran services. Chart 25 reveals steadily increasing statewide costs after extrapolating from the responses of 83 counties. An overall increase of 35.1 percent does not tell the whole story as every year the percentage increase has grown since FY 2012. Following a double digit increase of 10.7 percent from FY2015 to FY 2016, statewide expenditures hit $12.9 million. Total estimated expenditures for all 254 counties increased by 35.1 percent from FY 2011 to FY 2016.
Chart 25
Appraisal District Budgets
Following the property tax reforms of 1979’s Peveto Bill, local governmental entities stopped performing their own appraisals and delegated that task to 254 newly created appraisal districts – one per county. In order to finance their operations, appraisal districts obtain their funding from counties, cities, school districts and special districts – those local entities that collect a property tax.[12] Each entity pays a pro rata share of the appraisal district’s budget based on the local entity’s property tax levy; the more property taxes you collect, the higher your share of the funding.
Although expenditures, as extrapolated to all 254 counties, reached $66.0 million in FY 2016, overall growth was somewhat restrained. Over the survey period, statewide expenditures increased 17.3 percent.
Chart 26
Open Meetings
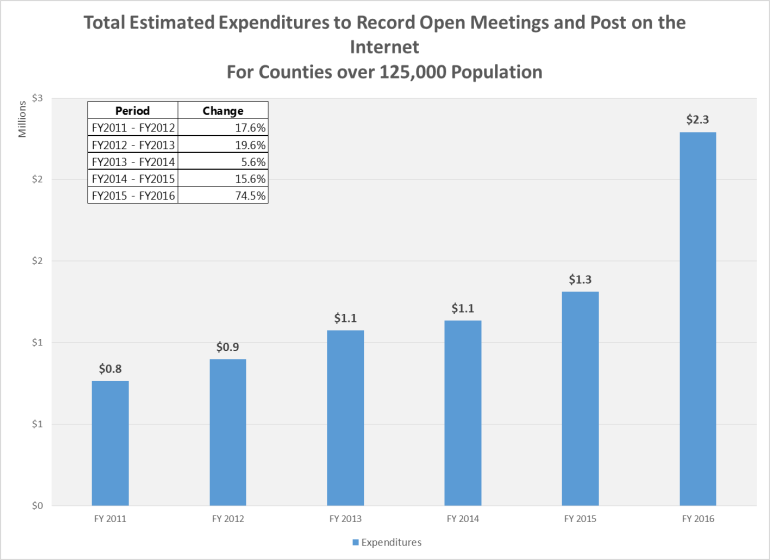
Effective January 1, 2016, the state requires counties with populations of 125,000 or more to post audio and video recordings of open meetings to the internet.[13] Based on their 2010 Census populations, only 31 counties fit into this bracket. Of those, nine provided their expenditures for FY 2011 through FY 2016 for posting their recorded open meetings.
Chart 27 tracks the growth of those expenditures as extrapolated to all 31 counties in the population bracket. What had been fairly rapid growth in expenditures, often greater than 15 percent, skyrocketed in FY 2016 as costs to counties increased by a total of 199.7 percent over the survey period as a result of this recent mandate.
Chart 27
Other Mandates Not Included in Survey
This section contains information on additional unfunded mandates. These mandates were not covered by questions in the survey; instead, the data comes from other sources.
County Roads and Bridges – Oversize/Overweight Trucks
In general, each county maintains responsibility for public roads and bridges within its boundaries although many exceptions exist to this general rule such as city streets and national or state highways. Legally, many large vehicles can operate on those roads. There are size and weight limits in place which restrict the use of that infrastructure by the largest and heaviest vehicles. However, operators of oversize and/or overweight (OS/OW) vehicles can obtain various permits allowing their vehicles to use public roads and bridges. In 2012, a TxDOT commissioned report, written by the University of Texas at Austin’s Center for Transportation Research and the University of Texas at San Antonio, evaluated the damage that oversize/overweight (OS/OW) vehicles (including exempt vehicles) cause to the transportation infrastructure (including roads and bridges).
The report focused on whether the revenue from permits sufficiently covered the cost of damages to state maintained roads and bridges. While it did not directly address county roads and bridges, the report provided a framework from which we can derive an estimate of the statewide costs to counties.
Based on usage data for a single type of permit from the report, Over-Axle Weight Tolerance (1547) Permits, and using a cost per mile one-half that utilized by the report to determine the cost of vehicles operating under a 1547 permit to state roads, it is estimated that counties suffered net losses (revenue from permits minus the cost of damages to county roads and bridges) of $145.7 million in 2014 and $152.6 million in 2015.
Many other types of permits exist, therefore, the actual net losses to counties most likely are significantly higher.
Indigent Defense – Court-Appointed Counsel in Criminal Cases
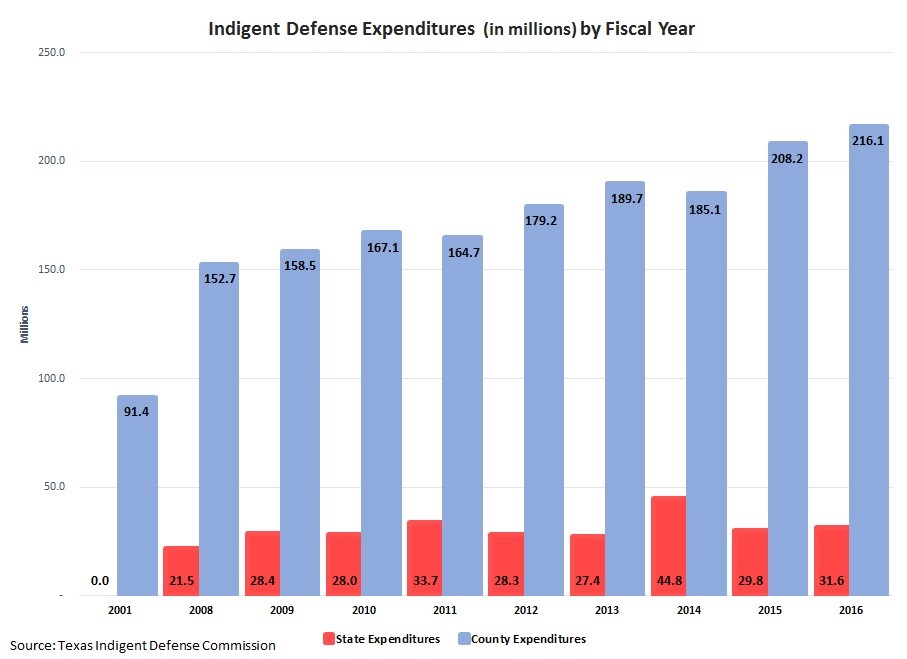
When criminal indigent defendants cannot afford counsel, counties pick up the tab. The state chips in some funds, but the vast majority of the funding comes from the counties as Chart 28 shows.
Chart 28
Indigent Defense – Court-Appointed Counsel in Criminal Cases
When criminal indigent defendants cannot afford counsel, counties pick up the tab. The state chips in some funds, but the vast majority of the funding comes from the counties.
Statewide criminal indigent defense costs have increased from $91.4 million in 2001 to $247.7 million in 2016, a 171 percent increase. However, state grants distributed by the Texas Indigent Defense Commission have covered only a small proportion of total costs. In FY 2016, the state funded only about $31.6 million of the total statewide indigent defense costs, while counties contributed approximately $216.1 million (about 87 percent of the total expenditures).
This data came from the Texas Indigent Defense Commission’s presentation: Senate Finance Hearing, Feb. 7, 2017, Legislative Appropriations Request FY 2018 and FY 2019.
[1] Tex. Code Crim. Pro. art. 103.0033
[2] Tex. Code Crim. Pro. art. 56.04(b)
[3] Tex. Gov’t. Code §§61.001 and 61.0015.
[4] Tex. Occupations Code §1704.051 et seq.
[5] Tex. Health & Safety Code, Chap. 61
[6] Tex. Code Crim. Pro. art. 104.002 and Tex. Health & Safety Code, Chap. 61
[7] See, for example Tex. Local Gov’t. Code §§81.0025(a) and 84.0085(a).
[8] There are a few counties that do not have a jail. However, they were included in the survey responses and therefore they were included in the extrapolations.
[9] Tex. Health & Safety Code §694.002
[10] Tex. Code Crim. Pro. art. 49.01
[11] Tex. Gov’t. Code §434.031 et seq.
[12] Tex. Tax Code §6.06
[13] Tex. Gov’t. Code §551.128


